Client
Platform for automated and algorithmic trading in financial markets
For over 9 years, Tradematic's clients have been making money on exchanges and crypto-exchanges by selling and buying currencies.
Creation of trading robots without programming, automation of asset management, building infrastructure for investment business - these are the key activities of the company.
Task
An investment advisor, which helps to build a trading strategy at the stock exchange and get profit out of each invested ruble
The new application should simplify the work of the company's clients on financial markets, making currency and stock trading as fast, convenient and profitable as possible.
The client has set us a task to develop an application, which allows viewing the catalog of financial instruments, getting the personal financial news, opening and closing the deals from anywhere in the world.
Solution
Optimized the API and paid special attention to data exchange
To simplify the API in our client-server iOS app, we plugged in the Alamofire library. This allowed us to use a set of out-of-the-box solutions, such as request/response methods and authentication tools.
With URLSessionWebSocketTask we implemented data exchange using the WebSocket protocol standard. And also we connected the Firebase libraries. This allows us to exchange data in real time, which is fundamentally important for this application.
Personal Investment Analyst
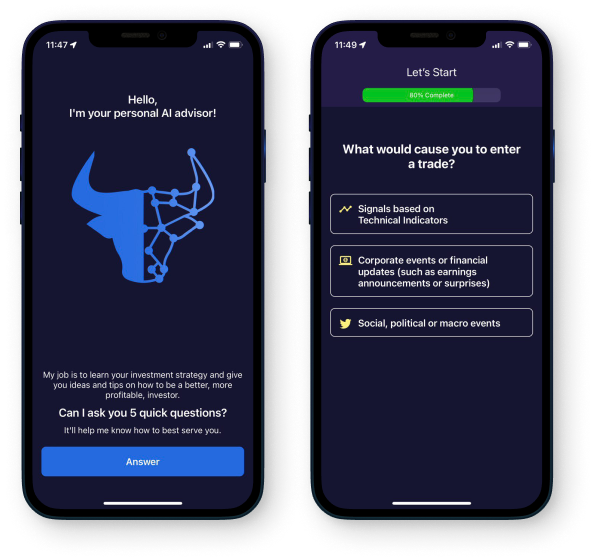
When the user first logs in to the app, they are to answer a few questions. The answers allow you to personalize the data in the application for a particular player, making it easier for him to work on exchanges.
Pop-up tutorials
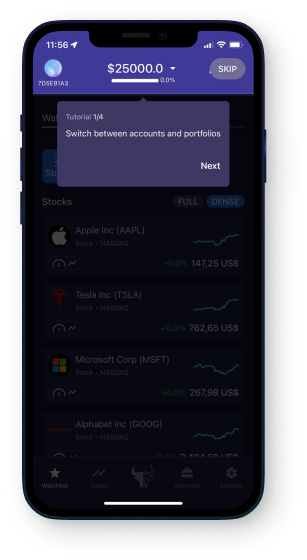
For newcomers, the application features tooltips that familiarize users with the interface. Everyone with different experience and technical knowledge can use the app.
If you already know everything, you can skip the tips. To do this, we have added a Skip button in the upper right corner of the screen.
Denis
WINFOX Project Manager
Visualization of stock market events
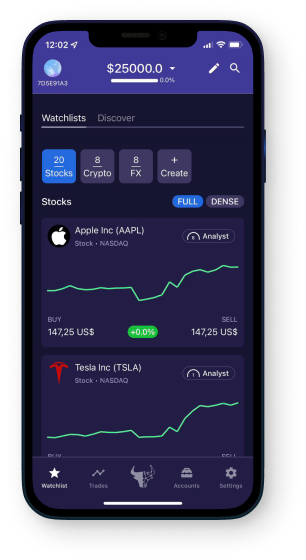
Viewing the home screen, you can see how stocks are doing on different exchanges. The line chart opposite each exchange shows whether stocks have risen or fallen in value.
Key indicators for quick stock analysis
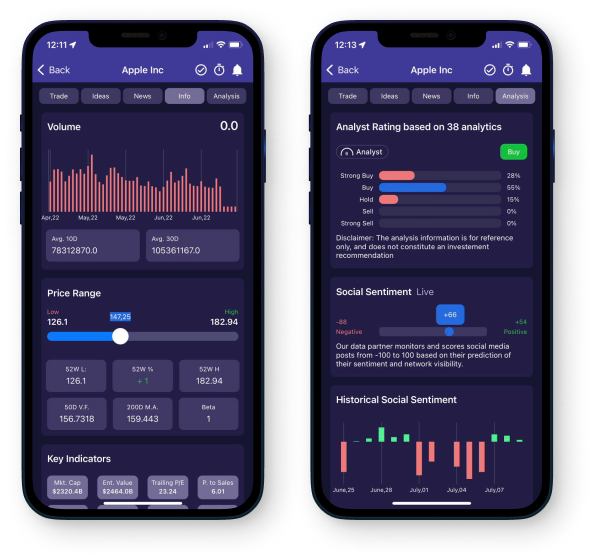
To help investors analyze whether to invest in stocks, what the risks are and how much they will earn, we have compiled all the relevant data in the Info section.
The dynamics of price changes on the stock exchange
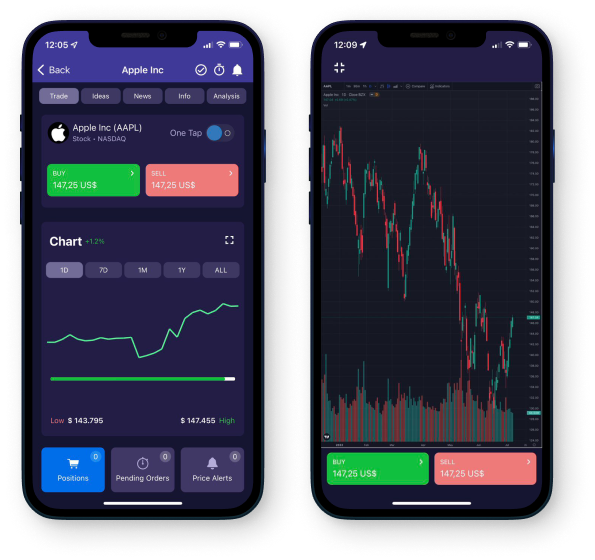
You can see how the price of a stock has changed over different periods of time: a day, a week, a month, or a year.
To allow the investor to view the chart in detail, we have added a "Full Screen" button. By clicking on it, the user sees the most detailed visualization. You can change the chart scale with customary gestures.
Denis
WINFOX Project Manager
The user`s balance
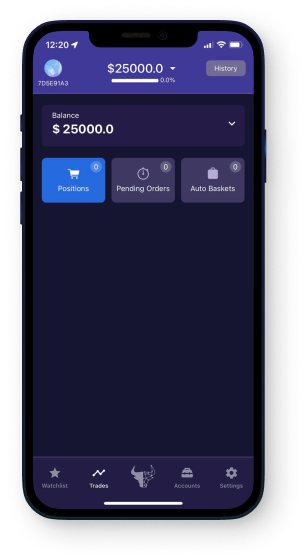
In the Trades tab, the user can see how much money is in his account, which stocks he has already bought and which are waiting for pending execution.
Personal settings
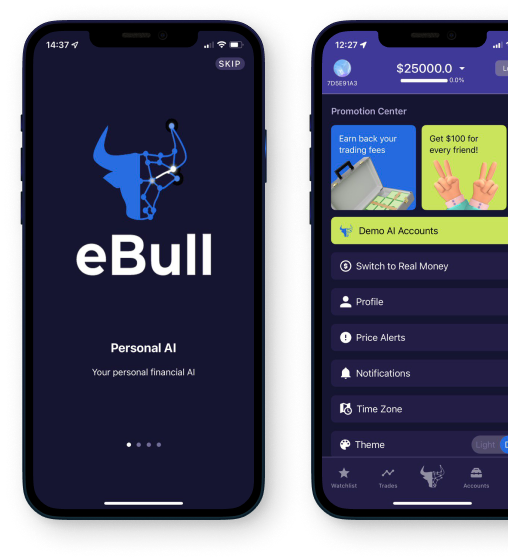
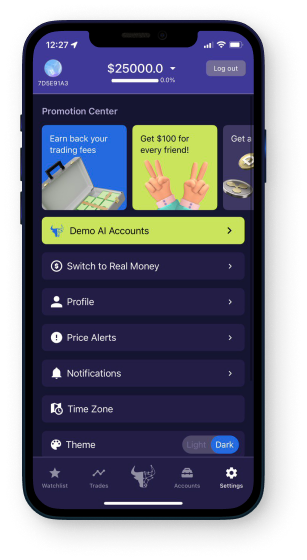
By clicking on the gear in the bottom menu, you can edit your personal profile, set up notifications, select the time zone, see the economic calendar with important events in exchanges.
Result
It has never been easier to make money in the stock market! Traders now have another tool for trading in financial markets.
It is now possible to buy and sell currencies, play on the differences in exchange rates and manage your assets directly from your smartphone. It's convenient for both beginners and professionals.
